When we discuss new provinces in Pakistan, the conversation often begins with a number. Should there be 12 provinces? Eighteen? More?
I wanted to approach it from the other direction: what would any of these proposals actually mean for someone living in a particular district?
بات صرف نقشے پر نئی لکیریں کھینچنے کی نہیں ہے۔
It is also about where decisions are made, how communities are represented, and whether people can reach the institutions that serve them.
That question led me to build Subay Pakistan, an independent civic project that lets people explore different provincial arrangements through maps and census information. It is a work in progress, and I want its assumptions to be open to discussion.
Different scales.
The same starting districts.
The website compares the current four-province structure with exploratory models containing 12, 18, 24 and 36 units. These numbers offer different scales to examine. They are not the result of a formula proving that Pakistan needs a particular number of provinces.
The smaller-number models combine districts into larger regional groupings. The higher-number models show a more divided administrative structure. Larger units may share institutions and resources across a wider area. Smaller units may bring some institutions closer to communities, while requiring additional administrations and expenditure.
The groupings are manually defined proposals. Geographic continuity, familiar regional groupings and administrative scale inform the approach. They have not been produced by an optimisation exercise that measures every road, budget or public preference.
The proposal totals include Islamabad as a separate federal-capital unit. This is a convention used in the comparison, rather than a claim about its present provincial status.
Why use districts?
Existing districts provide the building blocks. Each proposal brings together whole district entries rather than drawing entirely new boundaries through them. This lets visitors find their district, inspect its proposed neighbours and follow how published district statistics are combined.
A district can still contain communities with different needs, languages and connections to nearby cities. Keeping it intact does not settle those questions. It provides a starting structure that people can inspect and challenge.
Where the numbers
and outlines come from.
The main statistical reference is Pakistan’s 2023 Population and Housing Census, published by the Pakistan Bureau of Statistics. The district explorer uses a structured version of those tables through Muhammad Yaseen’s PakPC2023 package. Both the official authority and the intermediate data source are identified in the project’s source notes.
People across the 136 entries in the project’s 2023 census snapshot, including Islamabad.
Comparisons with 2017 use the supplied comparison base. Later district divisions should not simply be assumed to have existed in the same form in both years.
Adding counts is the straightforward part
For a proposed province, population is calculated by adding the populations of its constituent districts. The same principle applies to counts such as households. Rearranging districts changes the grouping, not the number of people in the underlying census snapshot.
Percentages require more care. Literacy relates to a particular population group; a household-service indicator relates to households. These figures cannot all be combined using the same denominator.
The current implementation includes weighted summaries for some proposal-level indicators. Those summaries need an indicator-by-indicator review before they should be treated as exact equivalents of an official census tabulation.
Coverage also matters. The detailed-characteristics base contains 240,458,089 people, smaller than the headline population, because some restricted areas supplied headcounts without the same detailed information. A percentage should therefore be read alongside its definition and coverage.
The map is a separate source
The district geometry comes from the WFP/OCHA administrative-boundary dataset distributed through the Humanitarian Data Exchange. Its boundary snapshot dates from 2022, while the census figures refer to 2023.
Matching them requires care because district names and boundaries change. The project’s coverage notes identify five census entries—Surab, Keamari, Karachi West, Karachi South and Malir—for which sufficiently verified census-year outlines are unavailable in the current release. The data remains available, with reference-outline arrangements used for display.
Gilgit-Baltistan and Azad Jammu and Kashmir appear geographically, while their regional information is kept separate from the 136-entry comparison baseline.
اپنے علاقے کو لوگ خود بہتر جانتے ہیں۔
These distinctions can seem technical until someone finds their own district displayed incorrectly. Local knowledge is an important part of checking the map.
Start with a place
you know.
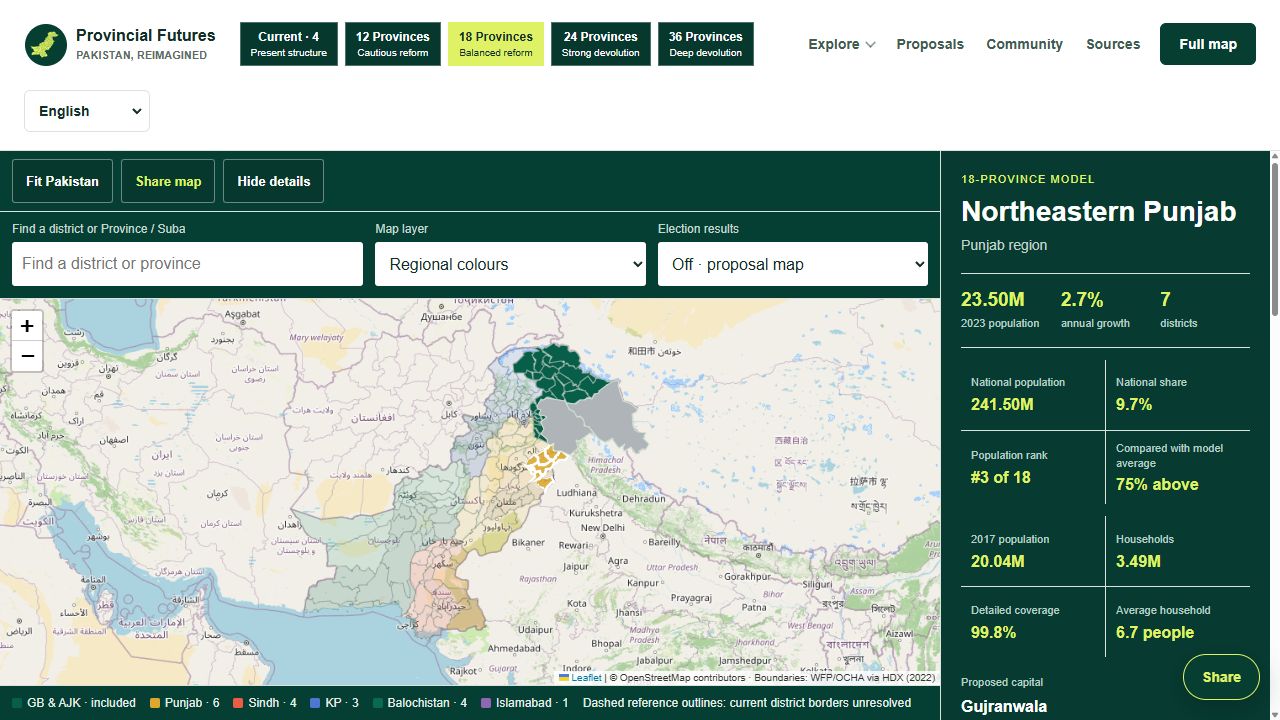
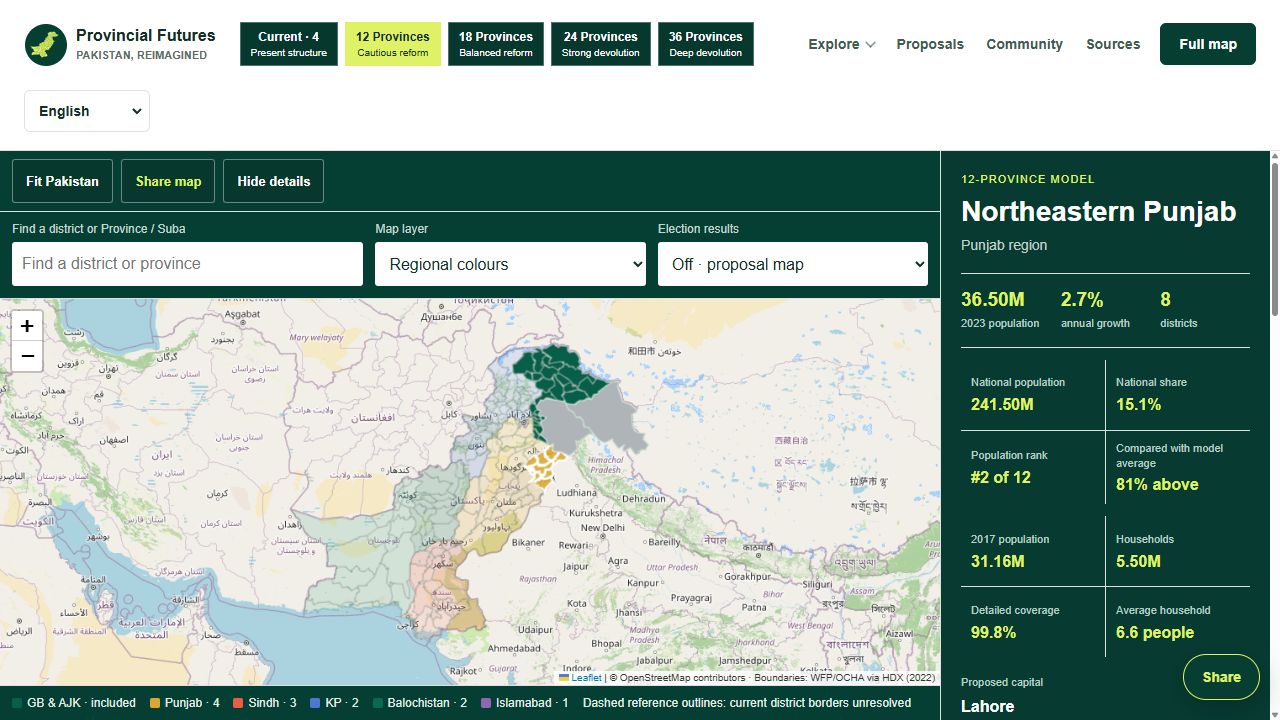
Gujranwala is a useful example. In the 12-unit model, it belongs to a Northeastern Punjab grouping that includes Lahore. In the 18-unit model, Lahore is a separate grouping and Gujranwala becomes the suggested capital of Northeastern Punjab.
- Open the full map and choose a model.
Use the 4, 12, 18, 24 or 36 buttons at the top. These change the proposed grouping of the districts.
- Find your district.
Type its name in “Find a district or Province / Suba”, or select it on the map. The details panel shows the proposed unit, its population and constituent districts.
- Switch models and select your district again.
Compare the district list and suggested capital. A different total describes a different grouping of people; it does not mean the population has suddenly changed.
- Read the sources, then share your question.
Use “Share map” to pass on the view. Include the model and place you are discussing so others can follow the same comparison.